Trojan 2014 Sexual Health Report Card (via Twitter)
Earlier this year, Trojan (the condom brand, duh) released its 2014 Sexual Health Report Card. Now in its ninth year, the Report Card measures sexual health resources for 140 colleges selected from the Bowl Championship Series. Scoring categories include student health centers’ access to quality information, STI and HIV testing and condom and contraceptive availability, among other points.
This year, PAC-12 school Oregon State wrested the #1 spot from Princeton University. As the Report Card notes, the top spot has typically vacillated between the Ivy League and the Big Ten. The PAC-12 also took spots #4 (University of Arizona) and #5 (Stanford) in the top 10.
I wanted to see if there were any discernible patterns within the data, so I crunched some numbers and played with some pivot tables.
By College Conference:

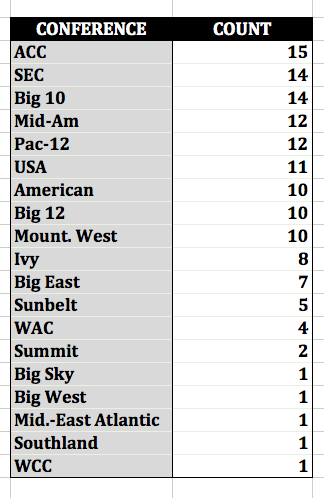
Trojan Sexual Health Report Card 2014: College Conferences
The Atlantic Coast Conference (ACC) took the top spot for conferences with 15 entries, and the Southeastern Conference (SEC) came in tied second with the Big Ten with 14 entries each. The Mid-American and PAC-12 conferences each have 12. Conference USA boasts 11 schools, and the American, Big 12 and Mountain West schools each have 10 schools.
The ACC, SEC and Ivy League all had each of its schools place within the rankings.
By School Type:

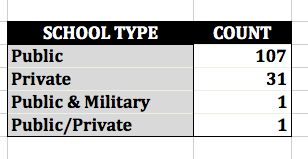
Trojan Sexual Health Report Card 2014: School Type
Over 76% of ranked schools were public schools, and 22% of schools were private. Ivies comprised over 25% of private schools listed.
Virginia Tech was categorized as public and military, and University of Pittsburgh was public and private.
By State:
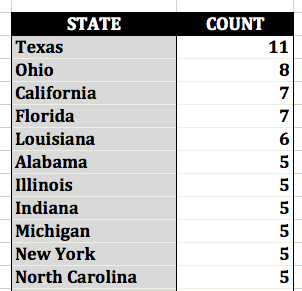
Trojan Sexual Health Report Card 2014: States
Texas boasts 11 schools ranked, while Ohio has eight schools for second place. California and Florida tie with seven schools each. Louisiana has six, and Alabama, Illinois, Indiana, Michigan, New York and North Carolina each have five schools represented.
On the other end of the scale, several states are one-hit wonders: Hawaii, Maryland, Minnesota, Missouri, Nebraska, New Hampshire, Washington D.C., and Wyoming.
By Region:
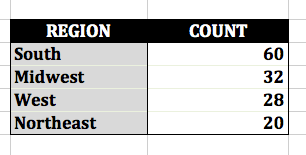
Trojan Sexual Health Report Card 2014: Region
Here’s something interesting: The South makes up 42%+ of the report’s regional breakdown. I didn’t expect that considering the region’s traditionally rocky relationship with sex education.
By contrast, the Northeast comprises only 14%+.
Past Winners:
In the report card’s nine years of age, Ivy League schools have taken the crown four times: Yale (2006, inaugural year), Columbia (2010 and 2011), and Princeton (2013).
Columbia and Princeton have previously topped the list despite not having school-wide Sex Weeks.
Some previous winners have precipitously descended the list since their banner year. University of Minnesota-Twin Cities made #1 in 2007, but has since slid to #24, a rate of 2.8+ spots per year. University of South Carolina-Columbia topped the list in 2009, and is now 29, sliding down the list at a much faster 5+ spots a year. Yale descended to #44 this year, sliding the fastest at 5.3+ spots per year.
Interesting Outliers:
Despite Trojan’s claim to show schools from all 50 states in their report, Alaska is conspicuously absent.
Only one HBCU (historically black college or university) made the cut: Savannah State University in Savannah, Georgia. The school came in at #133. Savannah State has made the list before, ranking #134 in 2013.
Indiana University-Bloomington checks in at #36. This wouldn’t be weird except the university houses the Kinsey Institute. You’d think sexual health would be a priority considering it’s apparently lucrative research.
Methodology:
Trojan outlined the criteria they look for within the report (and even leave room for extra credit), and they’ve ranked schools on a 4.0 scale before. I’d like to learn more transparency about how the different factors were selected and weighted in terms of priority.
One weird thing was that the University of Alabama was listed twice, ranked both #30 and #120. This was confusing and will need to be corrected for future report cards.
Final Thoughts:
I’d love to see more diversity of school represented. It’d be great to see other HBCUs (Spelman, Morehouse, etc.) and art schools (Pratt Institute, RISD, etc.). The National Center for Education Statistics puts the number of four-year colleges at 2.8K+ (as of 2010-2011), and it’d be fantastic to see a wider swath of schools surveyed.