‘Mad Men’ Don Draper, Midge Daniels, Megan Calvet Draper, Betty Draper, and Dr. Faye Miller (Vulture)
Today’s post is an update of this post, in celebration/memoriam of last night’s “Mad Men” series finale. Now that the series has ended, we can make more definitive statements on what kind of women Don prefers.
Everyone who watched the show knows that Don Draper (Jon Hamm) is a serial womanizer. Even when he’s married, he can’t stay faithful. It’s part of what makes him so intriguing: we know he’s wrong, but we couldn’t stop watching!
There’s been some ink spilled on the types of women he tends to bed, such as preferring docile women for marriage versus favoring strong-willed career women for affairs. But I was curious to find out if there were any other patterns, and so had some fun with Excel.
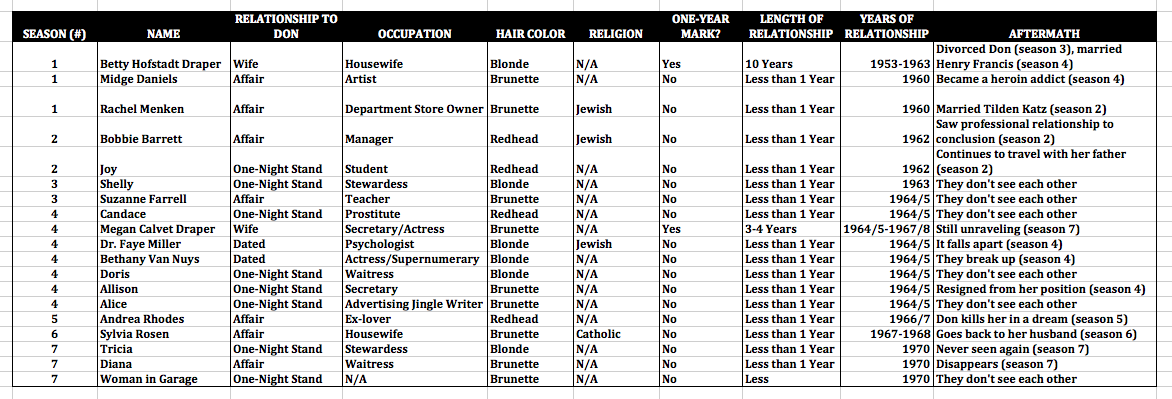
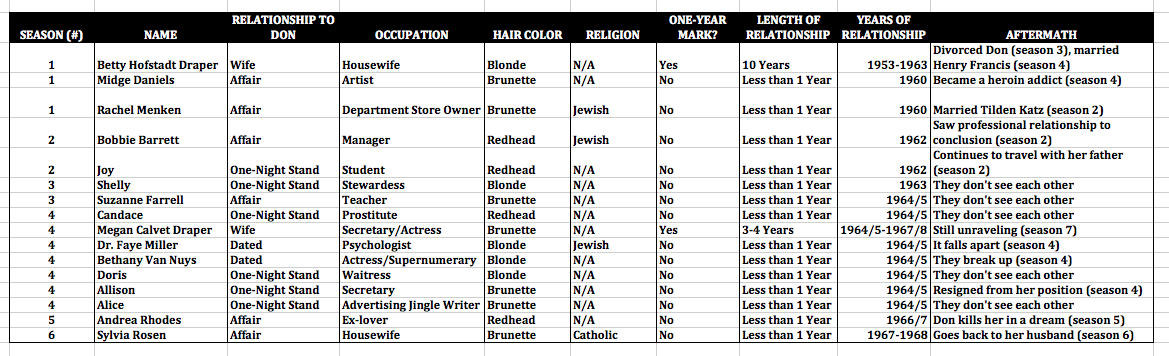
For fun, here’s what my entire Excel spreadsheet looked like:

‘Mad Men’ Don Draper Conquests Excel Spreadsheet UPDATED
If you can’t see, I listed the names of Don’s 19 partners by season, their relationship to Don, occupation, hair color, religion, and overall length of the relationship. (Some of these metrics I didn’t end up using.) Some of these things I tried finding information as accurate as possible (such as the years each relationship spanned), but sometimes had to make a close guess. So if you see an error, please correct me and I’ll recalculate.
Now, let’s find some patterns via pivot tables.
Don’s Relationships by Type:
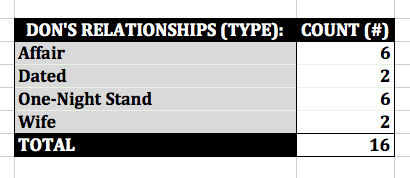
I broke down Don’s relationships into three types: wife, affair and one-night-stand. I defined affair as on-going with an emotional component, whereas I defined one-night stand as purely sexual, even though it may have happened more than once (as is the case with season 4’s Candace and season 7’s Tricia).
That being said, here’s the data:

‘Mad Men’ Don’s Relationships by Type Excel Pivot Table UPDATED
We know he’s been married twice (I’m not counting Anna Draper, as she was never a conquest), so no surprise there. I figured Don has had more casual partners than serious ones, but I didn’t realize how much it would skew. Don’s had over three times as many affairs and one-night stands combined as he has married and dated partners combined. Interesting.
Partners’ Occupation:
I was interested to see if Don had any particular type in terms of career. Though every woman was different, four occupations reoccurred, and all of them roughly at the same rate.
Two of the 16 women (12.5%) were housewives, which were his first wife Betty and later season 6’s Sylvia Rosen. Another pattern that emerged were two actresses, who also held other jobs when Don knew them. These two were season 4’s Bethany Van Nuys (whose other job was a supernumerary) and his second wife Megan Calvet (who began as a secretary).
Don’s partners in season 7 made a couple more occupations a trend. Tricia was the second stewardess, with the first being season 3’s Shelly. Waitress Diana came after season 4’s Doris, also a waitress.
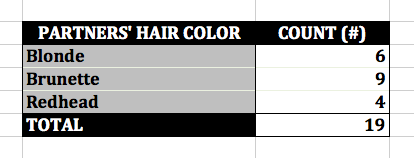
Partners’ Hair Color:
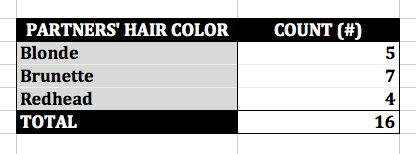
Gentlemen prefer blondes, but does Don? Let’s take a look:

‘Mad Men’ Don’s Partners’ Hair Color Excel Pivot Table UPDATED
No, Don’s more of a brunette man, with nearly half his partners sporting the color. He prefers blondes slightly more than redheads.
Religion:
I initially wanted to see how each partner’s religion broke down. Several did not mention or show any religious leanings, so I referred to their respective affiliations as “N/A,” because I didn’t want to automatically put partners into a “default Christian” category.
Only two of the 16 partners (12.5%) were overt about their religious affiliation: season 1’s Jewish department store heiress Rachel Menken, and the Catholic Sylvia Rosen (season 6, though she’s married to a Jewish man).
Other partners signaled their religious leanings indirectly. Season 4’s Dr. Faye Miller (Cara Buono), referenced her Jewish heritage in passing, using a Yiddish phrase. Season 2’s Bobbie Barrett was confirmed to be Jewish by none other than show creator Matthew Weiner himself.
What we can take from this is that while religion certainly isn’t a conscious preference of Don for his partners, he has selected distinctly Jewish women.
Duration of Relationship:
How long did each of Don’s dalliances last? Unsurprisingly for most of them, not very long:
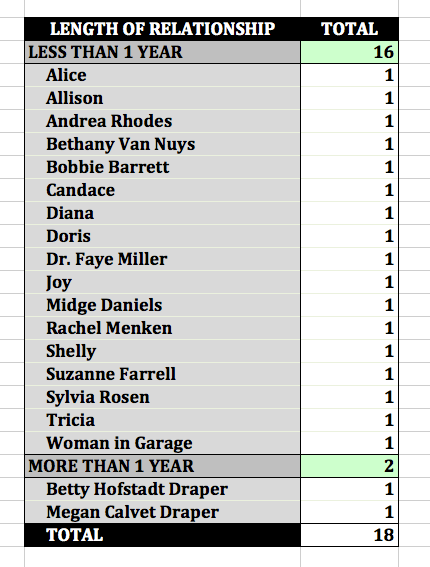
‘Mad Men’ Don’s Length of Relationships Pivot Table UPDATED
I initially had assumed that some would’ve spanned more than a year, but the only partners with proven staying power have been his wives Betty and Megan.
Conclusion:
Delving into the metrics of Don’s sexual partners reveals some interesting findings: He prefers brunettes, doesn’t discriminate on the basis of religion or career, and has a short attention span when it comes to women.