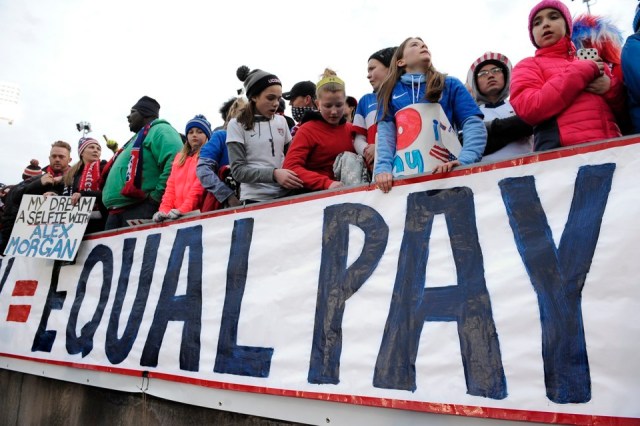
Equal Pay March (The Atlantic)
Everyone knows that women get paid less than men. (If you don’t know that by now, you’re welcome.) You may have heard that stat that women make 75 cents to every dollar a man makes.
This got me curious to see what the pay gap has been throughout recent history. I found long-range pay gap data from Pay Equity Information. I then made a data table to cherry-pick my desired years:

Gender Pay Gap Data, 1960-2015 (Pay Equity Information)
Then I created a line graph to see the difference visually:

Gender Pay Gap: 1960-2015 chart (Pay Equity Information)
As you can see, the pay gap was worst in 1960-1980. Only after 1980 does the ratio start to approach 70 cents to a dollar. And there’s still so far to go.
