FILE PHOTO – Kim Kardashian and Kanye West arrive at the 2016 MTV Video Music Awards in New York, U.S., August 28, 2016. REUTERS/Eduardo Munoz/File Photo
The 50th anniversary of the Loving v. Virginia case is soon approaching. The case struck down bans on interracial marriage, and continues to resonate today. With that in mind, I was curious to see any data on interracial marriages: Has the number gone up? Has societal disapproval gone down?
Let’s take a look:
Who’s Marrying Out?
- In 1970, less than 1% of all married couples were interracial.
- In 1980, 6%+ of newlyweds were interracial, and only 3% of all marriages were interracial.
- In 2013, 12% of newlyweds (a record high) married someone of a different race, and 6.3% of all marriages were interracial.
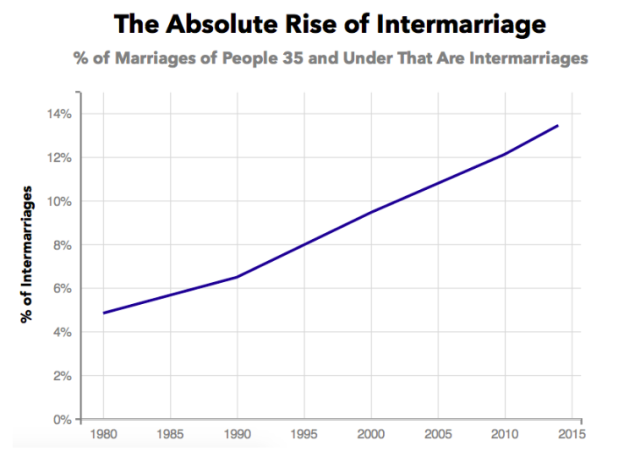
The Absolute Rise of Intermarriage (Priceonomics)
Who’s Down with Marrying Out?
- In 1986, only 30% of survey respondents felt interracial marriage is acceptable for everyone. But that same percentage of respondents did not feel interracial marriage was acceptable for anyone.
- In 2009, 83% of survey respondents were accepting of interracial marriage.
- In 2012, 93% of people approve of interracial marriage.
And let’s end on one more noteworthy statistic that warms my heart and gives me hope for the future:
“More than four-in-ten Americans (43%) say that more people of different races marrying each other has been a change for the better in our society.”