Sexy Elsa ‘Frozen’ Costume
In celebration of Halloween being my favorite holiday, I’ll be crunching some data about it in the upcoming days. Enjoy!
With Halloween coming up on Friday (!!!), I was curious about how the recent Google searches reflected the all-important costume search. Google Trends to the rescue!
I searched “Halloween costumes” (blue line) against “sexy Halloween costumes” (red line) for the U.S. during the past 30 days (Sept. 27-Oct. 27, 2014), with the following results:

Google Trends: ‘Halloween Costumes’ vs. ‘Sexy Halloween Costumes’
Unsurprisingly, the search for sexy Halloween costumes, while small, still made an impression. But I would’ve predicted it would’ve been a fair bit larger.
Now, the fun part! Let’s look at each of these searches by subregion (in this case, state), metro and city.
“Halloween Costumes” by Subregion:

‘Halloween Costumes’ by Subregion
States with larger populations make a strong showing here: Wyoming, West Virginia, North Dakota, Montana and South Dakota descend from 100% to 86%. Notable conservative state Utah appears at 78%.
“Halloween Costumes” by Metro:

‘Halloween Costumes’ by Metro
Pennsylvania areas Wilkes Barre-Scranton (100%) and Pittsburgh (92%) take the top two spots. Salt Lake City reappears with 87%. New York takes up two consecutive entries with Albany-Schenectady-Troy with 85%, and Buffalo with 83%.
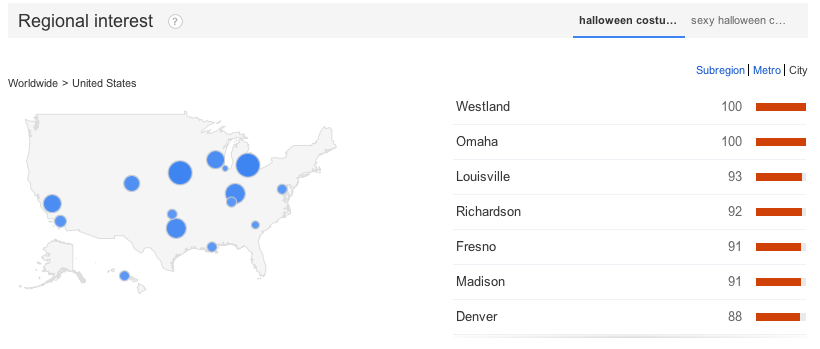
“Halloween Costumes” by City:

‘Halloween Costumes’ by City
Here we have something I haven’t seen before: a tie! Westland, Michigan and Omaha, Nebraska both sit at the top with 100%.
Other points of interest: Major US cities make the list further down. Los Angeles clocks in at #8 with 82%, and Washington, D.C. appears next with 81%. Also the first non-Lower 48 city appeared at #10: Honolulu with 81%.
“Sexy Halloween Costumes” by Subregion:

‘Sexy Halloween Costumes’ by Subregion
Third most-populous state New York sets the pace at 100%. (Most-populated state California enters the race halfway down the list at #5 with 88%.) Michigan and Florida tie with 92%, with Pennsylvania hot on their heels at 91%. Second-most populated state Texas clocks in at #9 with 79%.
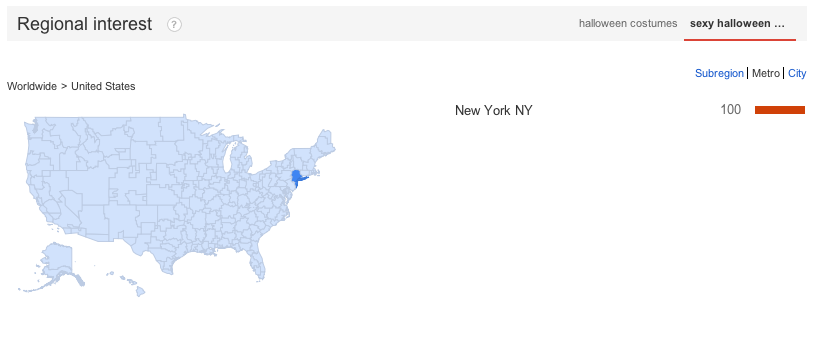
“Sexy Halloween Costumes” by Metro:

‘Sexy Halloween Costumes’ by Metro
I’ve never seen this before: only one entry. It’s New York, the most-populated metro area. Clearly, everyone in the greater New York City area is searching for sexy Halloween costumes…right?
“Sexy Halloween Costumes” by City:

‘Sexy Halloween Costumes’ by City
Interesting that the greater New York metro area is searching for sexy Halloween costumes more than the city’s residents themselves. But everyone in Los Angeles, the city proper, is Googling sexy costumes. Also of note is that all of these are very large cities (compared with the basic “Halloween costumes” search, which had smaller cities top the list).
Conclusions:
I didn’t expect this, but the “Halloween costumes” vs. “sexy Halloween costumes” searches tend to break down along urban/rural-ish lines. Those searching for “Halloween costumes” have tended to be from less-populated areas, whereas those Googling “sexy Halloween costumes” seem to be coming from more urban areas and making larger impacts.