1950s Population, U.S. Census
Taking it all the way back to the 1950s Census…
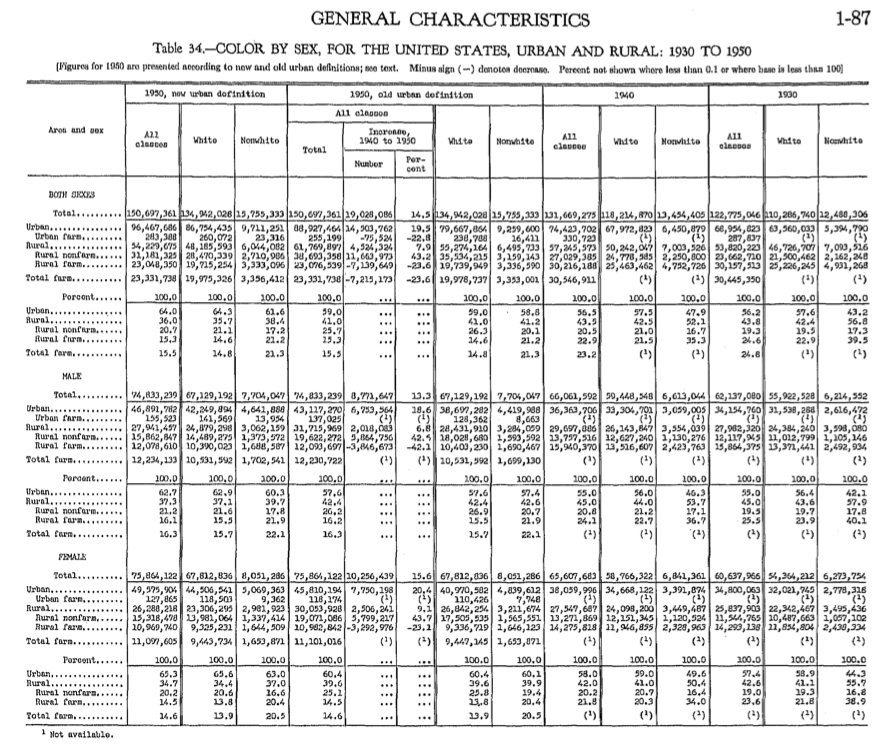
I used this table to assist with Monday’s married men/anal sex post. You can see the overall, male and female population breakouts (if you squint).
Use for 1950 Census findings
1950s Population, U.S. Census
Taking it all the way back to the 1950s Census…
I used this table to assist with Monday’s married men/anal sex post. You can see the overall, male and female population breakouts (if you squint).

Blue Man, Pink Woman
One interesting data point (among the many) the Census has is that of the sex ratio: the number of males for every 100 females. The 1950 Census finds a 98.6 sex ratio, i.e. 98.6 men for every 100 women, within the total U.S. population for all ages.
The ratio actually hits over 100 for a few categories, starting in childhood: Under 5 years, 5-9, 10-14 and 15-19 all registered high ratios. It begins to dip into the high 90s from age 20 to age 54. Ages 54-59 and 60-64 move back up to ratios over 100.
The next two age brackets (65-69 and 70-74) go back into the high 90s. But the last two brackets decrease more dramatically than any of the previous ones: Ages 75-84 has a sex ratio of 85.1 and ages 85+ has a 69.6 ratio. This makes sense, as men usually pass away earlier in life than women.
